The Monthly Trend breaks down your sales and profits statistics for each month, giving you an overview of the months with high and low sales.
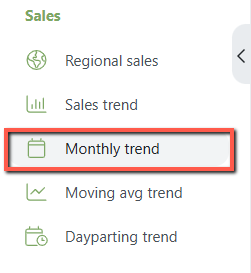
Navigation: Sales > Monthly Trend
Customize Report View
Customize the following to extract the desired report.
- Months: This field will set the number of months and aggregate data to look back.
- Last Date: This field will set the end date of the displayed data you want to analyze.
- Select Products: You can select 1 or multiple products to analyze. If no product is selected, it will display the overall stats for all products.
Click on the Filter button to view the report. 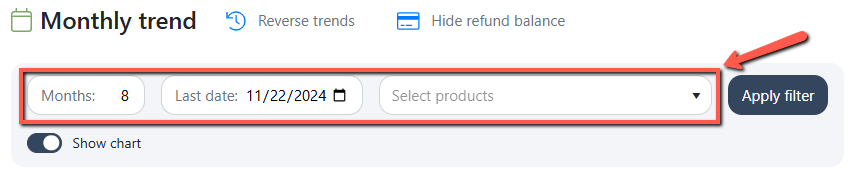
Sales and Profits Graphs
The 'Sales' chart shows your product's monthly units sold from your organic, promotions, and PPC sales. 
The 'Profits' chart shows your product's monthly sales, profits, PPC sales, and cost.
Get insights into how much revenue you have from running your Ads and the total monthly profit generated. 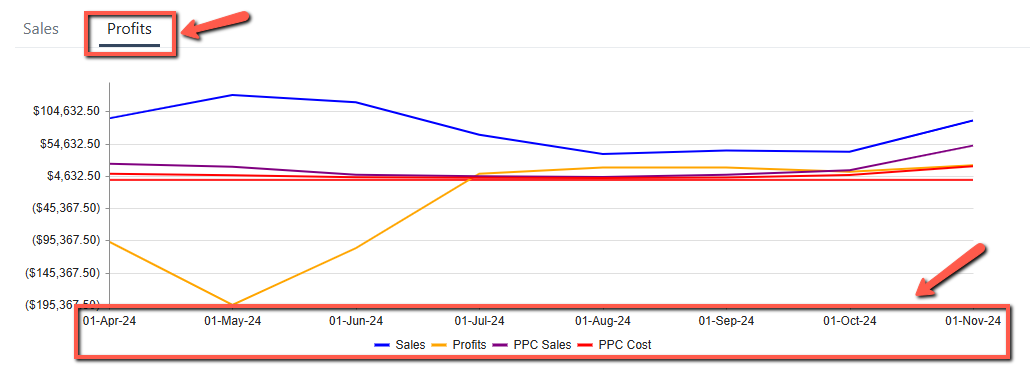
Key Metrics
Analyze key metrics and get granular insights into your product's performance.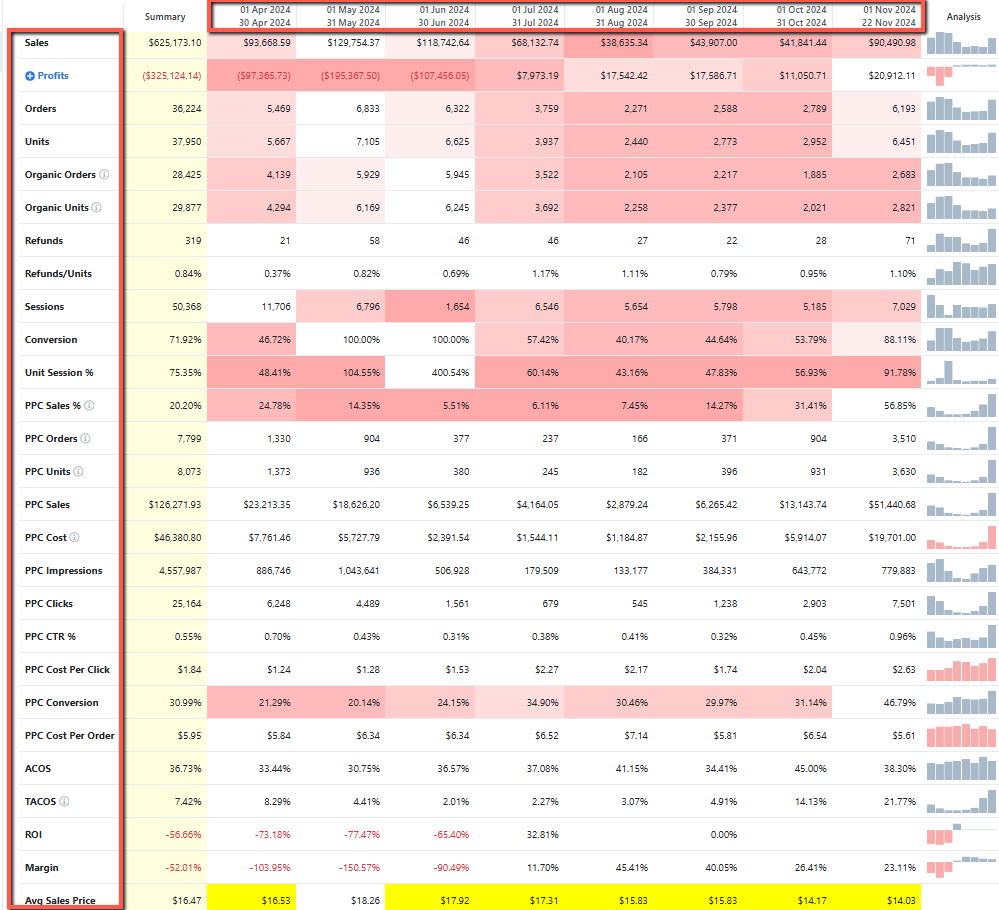
Download the Monthly Trend Report
Once you have customized the report view, you can download it in CSV format.
- Download as CSV: Use this to download a comprehensive sales report.
- Download Product Trend: Use this to download sales reports by product.
Note: The downloaded files will not include graphs.

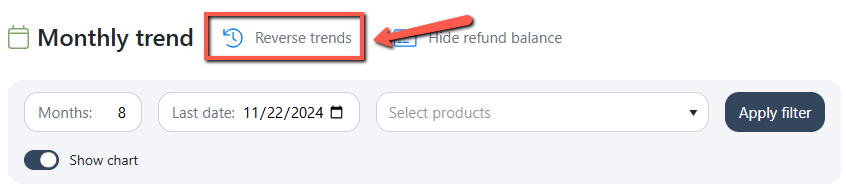
Reverse Trends
Using this option, you can display the dates in reverse order, starting with the Last Date.
Click the Reverse Trends icon at the top of the page.
The next you open the same report, the stats will appear in the reversed date order.
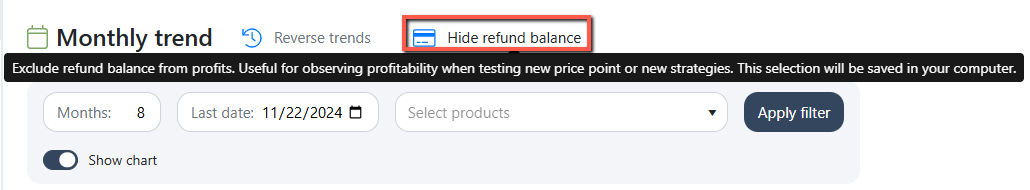
You can now include/exclude the refund balance from the Profit calculation. This feature helps observe profitability when testing new price points or strategies. This selection will be saved on your computer and is available for both Sales and Monthly Trends.
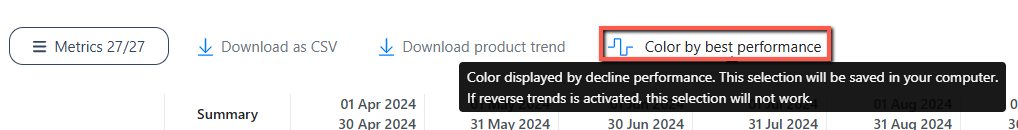
You can now change the color display of your data based on the best metric performance within the selected period. This selection will be saved on your computer and is available for both Sales and Monthly Trends.