The Moving Average Trend displays your sales and profits statistics for the past 7, 14, 30, 60, 90, 180, and 365 days from the last date you selected. The system adds all the data points during a specific period with progressively shifting intervals.
It gives an overall idea of the direction of your sales statistics over time and helps forecast your product's long-term sales trend.
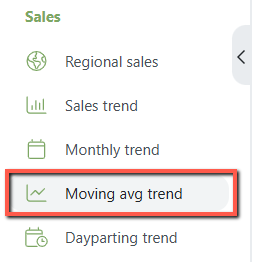
Navigation: Sales > Moving Average Trend
Use the following filters to define the time frame and the product for analyzing the moving trend.
- Last Date: This field will set the end date of the displayed data you want to analyze
- Select Products: You can select 1 or multiple products to analyze. If no product is selected, it will display the overall stats for all products.
Click on the Filter button to view the report. 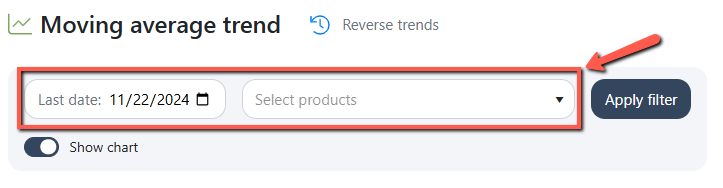
Sales and Profits Graphs
The 'Sales' chart shows your product's moving average of units sold from your organic, promotions, and PPC sales. 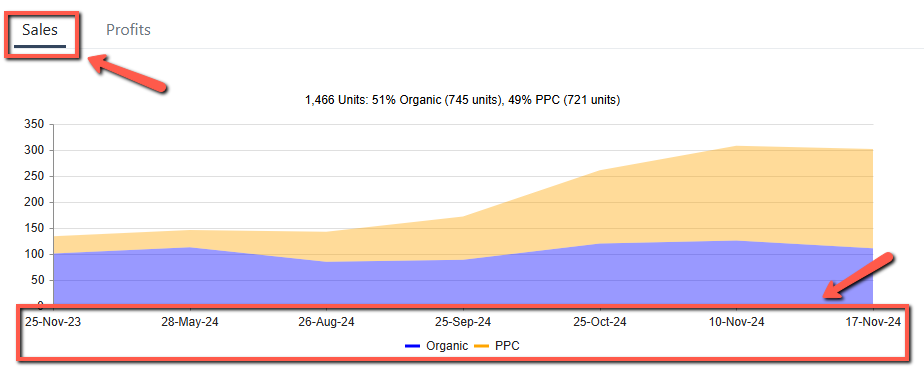
The 'Profits' chart shows the moving average of your product's overall sales, profits, PPC sales, and cost.
Get insights into how much revenue you have from running your Ads and the total profit generated each period. 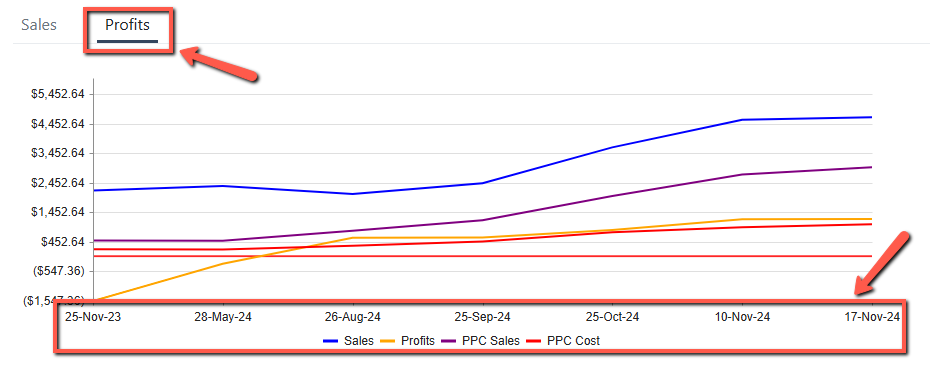
Key Metrics
To view the granular insights on your product's performance, look at the critical metrics given in the tabular format below the sales/profits graphs.
The moving average will take the total metrics value, and divide it by the number of days.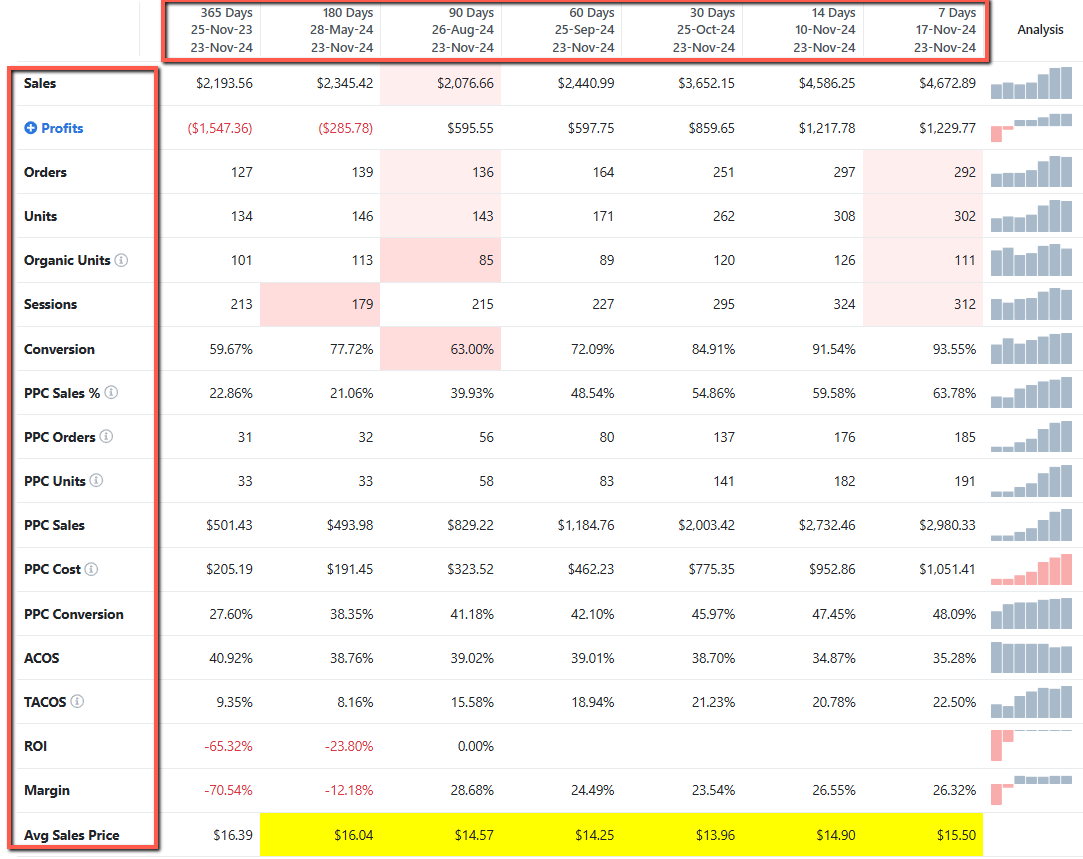
Download Moving Average Trend Report
Click on the Download as CSV option to download a comprehensive sales report in CSV file format.
Reverse Trends
Using this option, you can display the dates in reverse order, starting with the Last Date.
Click the Reverse Trends icon at the top of the page.
The next you open the same report, the stats will appear in the reversed date order.