Identifying the hours when your ads perform best can help you make better decisions about when to drive advertising activity.
You can use Amazon's hourly advertising data or Scale Insights reports to identify the hours when your ads generate stronger sales and conversions.
Method 1: Use Amazon's Hourly Sponsored Ads Report
Amazon Seller Central provides an Hourly Campaign report that lets you analyze advertising performance by hour. This can help you identify the times of day when your ads generate the highest or lowest sales and conversions.
How to generate the hourly report
- In Amazon Seller Central, go to Sponsored Ads Reports.
- Click Create Report.
- Select Campaign as the report type.
- Select Hourly as the time unit.
- Select the date range you want to analyze.
- Save and run the report.
- Once the report is generated, download the data from the report display.
Follow the steps in this video walkthrough to access and download your Amazon Hourly report.
How to analyze the data
Use the hourly report to identify when your advertising performance is strongest and weakest.
Look for patterns in:
- Sales — Which hours generate the highest sales?
- Conversions — Which hours generate the most orders?
- Spend — Are you spending heavily during hours with lower returns?
- Conversion rate — Which hours convert clicks into orders more effectively?
For example, if your report consistently shows stronger sales and conversions between 6 AM and 9 PM, these hours may be more suitable for driving ads.
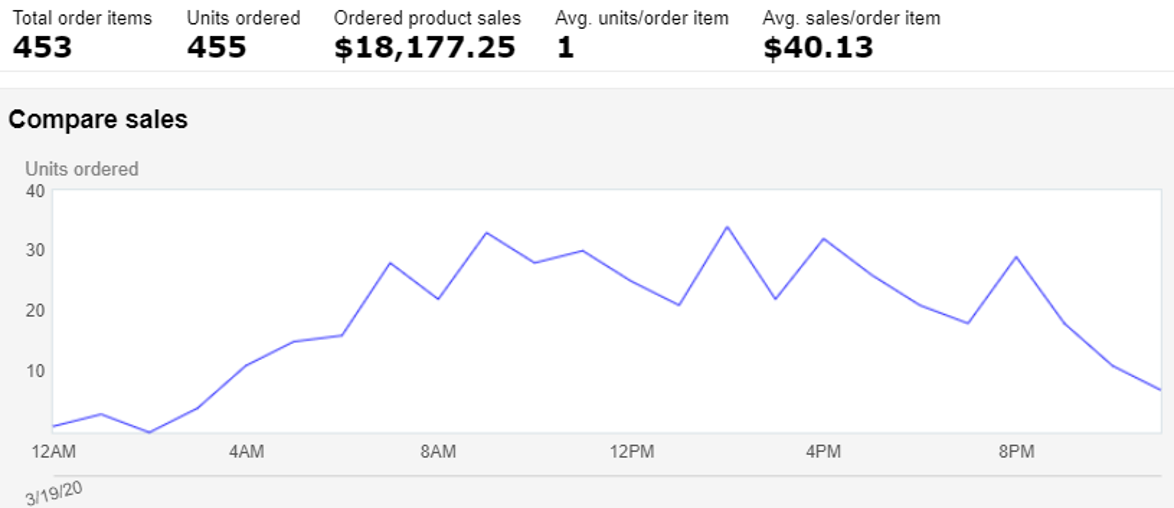
This method is particularly useful when you want to analyze recent hourly advertising performance directly from Amazon.
Method 2: Use the Dayparting Trend Report in Scale Insights
Navigation: Sales > Dayparting Trend
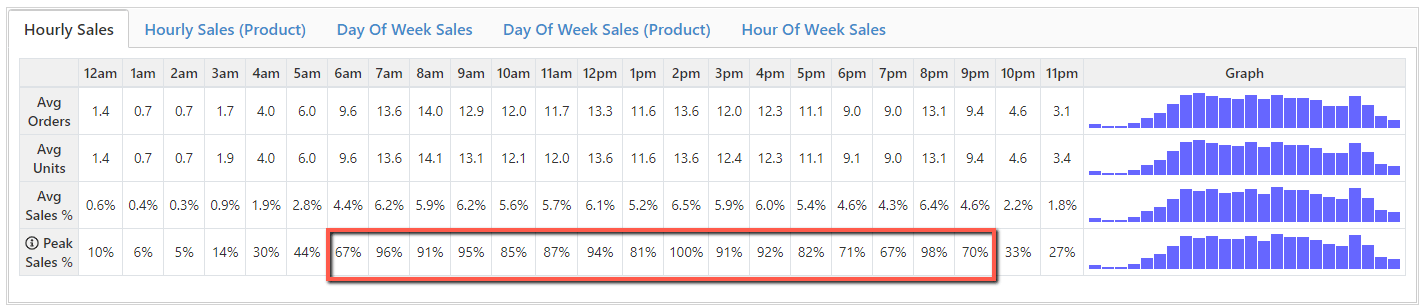
This report will aggregate your sales across a few weeks/months and display the average sales for each hour.
For example, in the below picture, we can see that the sales are higher from 6 am to 9 pm.
The Dayparting Trend report in Scale Insights aggregates your sales data over a longer period and displays the average sales for each hour of the day.
This can help you identify recurring hourly patterns that may not be obvious from a single day's data.
For example, if sales are consistently higher from 6 AM to 9 PM across several weeks or months, this may indicate that these are your stronger hours for driving ads.
Method 3: Create a Dayparting Campaign in Scale Insights
Navigation: Mass Campaigns > Dayparting Campaign
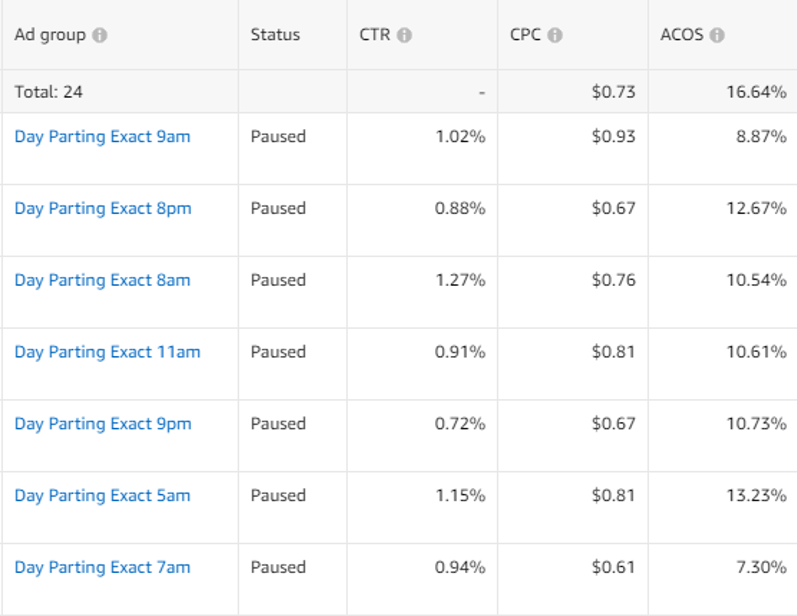
You can use Dayparting Campaign under Mass Campaigns to analyze and manage advertising performance by hour.
This creates 24 Ad Groups within a campaign, with each Ad Group representing one hour of the day. The Ad Groups use the same keywords and bids, allowing you to monitor PPC performance for each hour.
This can help you:
- Identify which hours generate stronger PPC performance.
- Compare performance across different hours.
- Control when your ads are active.
- Use hourly performance data to refine your advertising strategy.
💡 General guideline
If you don't yet have enough data to determine your optimum hours, you can use 6 AM to 10 PM as a general starting point.
However, optimum hours vary by product, marketplace, and customer behavior. Where possible, use your own hourly performance data to determine when your ads perform best.