The Sales Trend breaks down your sales and profits statistics against the selected period (daily, weekly, monthly, or any number of days), giving you an overview of periods with high and low sales.
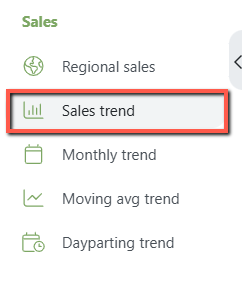
Navigation: Sales > Sales Trend
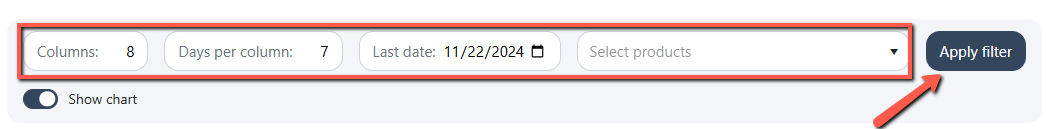
Customize Report View
Customize the following to extract the desired report.
- Columns: The number of columns will determine the oldest date and data to display.
- Days Per Column: This field will set the date range of aggregated data per column.
- Last Date: This field will set the end date of the displayed data you want to analyze.
- Select Products: You can select 1 or multiple products to analyze. If no product is selected, it will display the overall stats for all products.
Click on the Filter button to view the report.
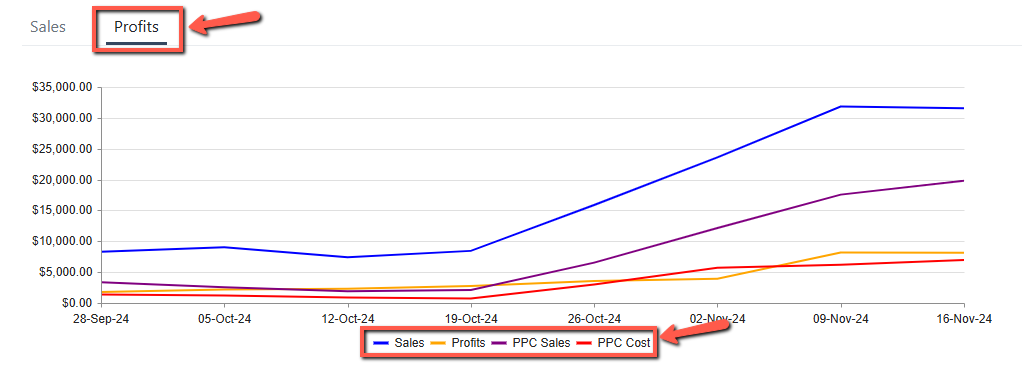
Sales and Profits Graphs
The 'Sales' chart shows your product's units sold from organic sales, promotions, and PPC sales against the "Days Per Column" timeframe.
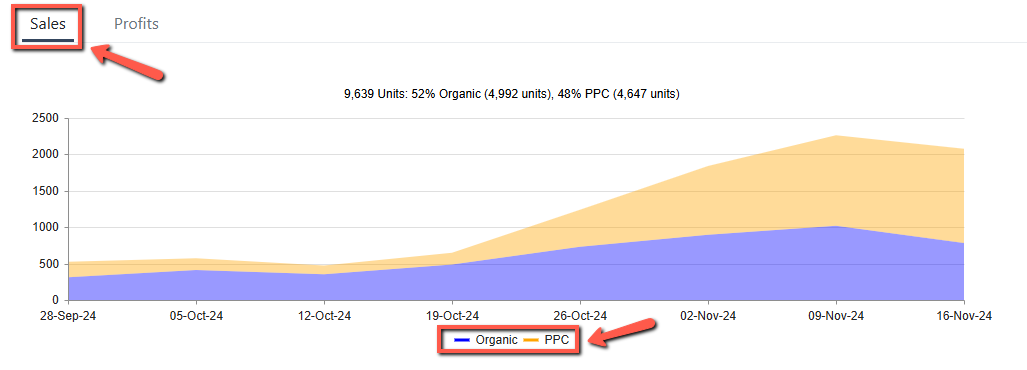
The 'Profits' chart shows your product's sales, profits, PPC sales, and cost displayed against the "Days Per Column" timeframe.
Get insights into how much revenue you have from running your Ads and the total profit generated for each timeframe.
Get granular insights on your product's performance by analyzing key metrics.
Trends Performance Indicators
The Sales Trend table gives you a glance at the metrics that are getting worse and better based on color.
The colors indicate increasing and decreasing metric performance as compared to the previous period.
- White indicates an improved performance.
- Pink indicates a decline in performance.
- The darker the color, the worse the performance.
- Yellow means there's a change in the average price.
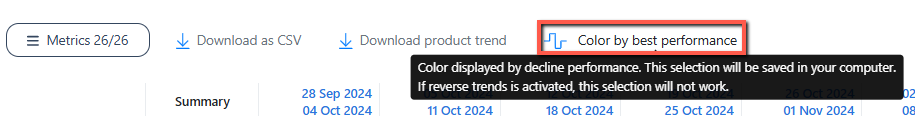
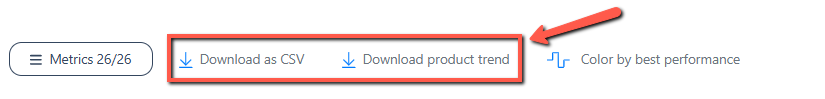
Download Sales Trend Report
Once you have customized the report view, you can download it in CSV format.
- Download as CSV: Use this to download a comprehensive sales report.
- Download Product Trend: Use this to download sales reports by product.
Note: The downloaded files will not include graphs.
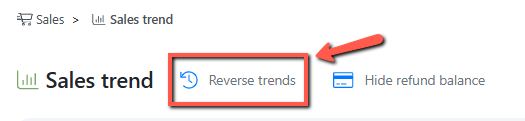
Using this option, you can display the dates in reverse order, starting with the Last Date.
Click the Reverse Trends icon at the top of the page.
The next time you open the same report, the stats will appear reversed.
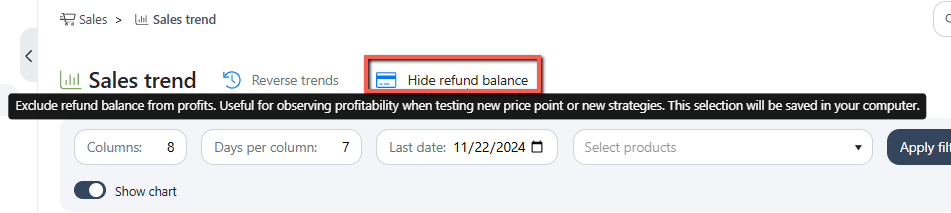
You can now include/exclude the refund balance from the Profit calculation. This feature helps observe profitability when testing new price points or strategies. This selection will be saved on your computer and is available for both Sales and Monthly Trends.
You can now change the color display of your data based on the best metric performance within the selected period. This selection will be saved on your computer and is available for both Sales and Monthly Trends.