The Dayparting Trend displays sales statistics for each hour of the day.
This feature gives an hourly/weekly overview of your product's performance and helps determine the most profitable hours or days of the week.
It looks at the overall number of orders (organic + PPC) and computes the average based on the evaluation period.
The hourly/weekly data follows the marketplace's time zone.
Navigation: Sales > Dayparting Trend
Customize Report View
To view and analyze sales statistics, customize the following filters
- Weeks: This field will set the number of weeks of aggregated data to analyze.
- Last Date: This field will set the end date of the displayed data you want to analyze.
- Select Products: You can select 1 or multiple products to analyze. If no product is selected, it will display the overall stats for all products.
Click on the Filter button to view the report.
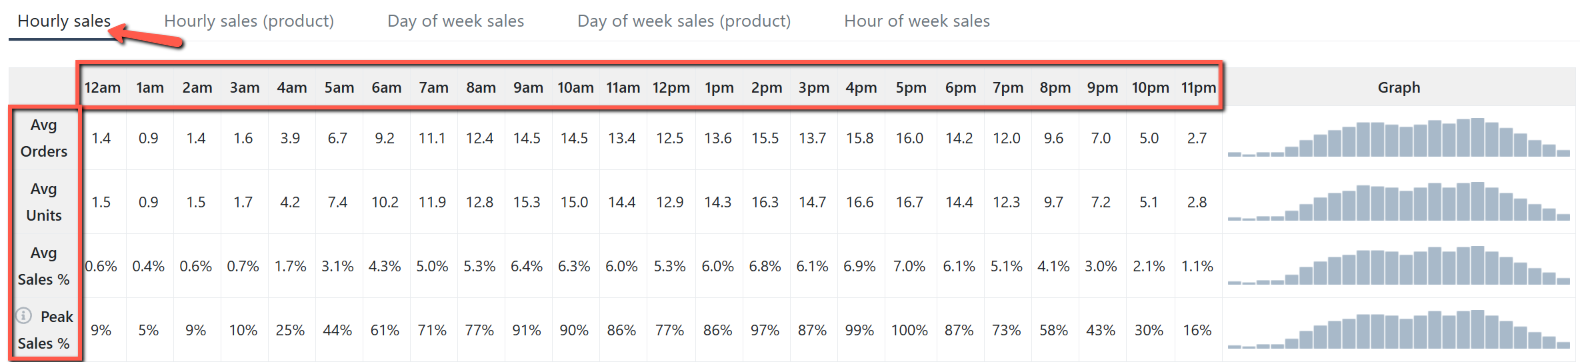
Hourly Sales
This tab shows the overall average orders and sales data for each hour of the day.
The formula for Peak Sales % is Hourly Sale/Highest Hourly Sale.
This tab shows the sales stats of each product. You can view the average orders and sales data for each hour of the day.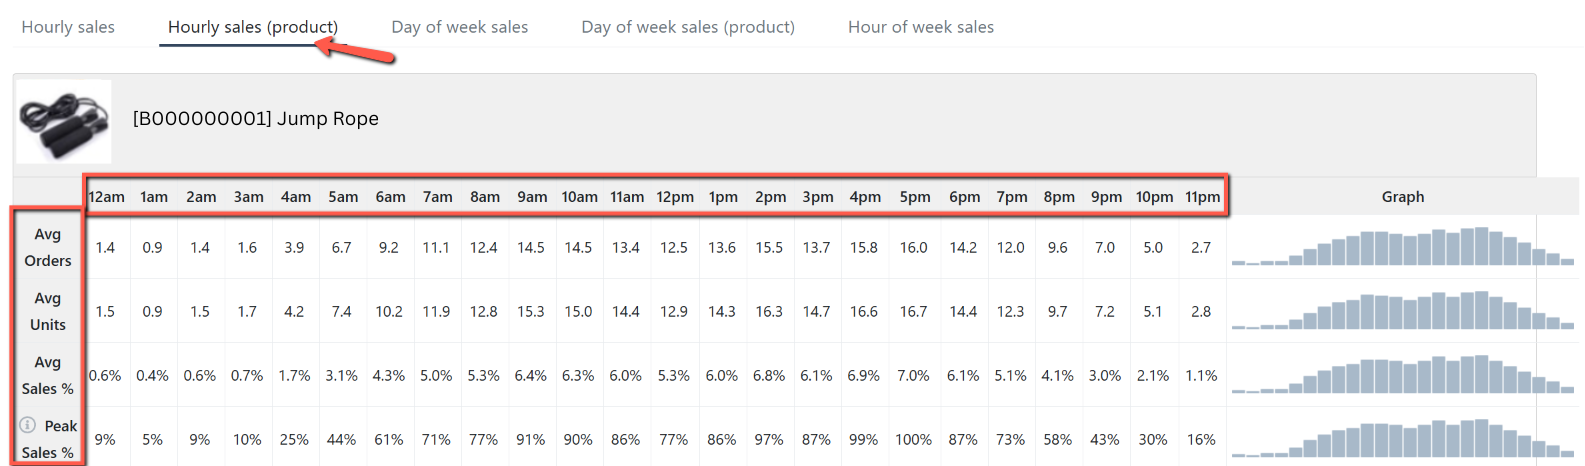
Day of Week Sales
This tab shows a breakdown of metrics data for each day of the week..png)
Day of Week Sales (Product)
This tab shows a breakdown of metrics data for each day of the week by product.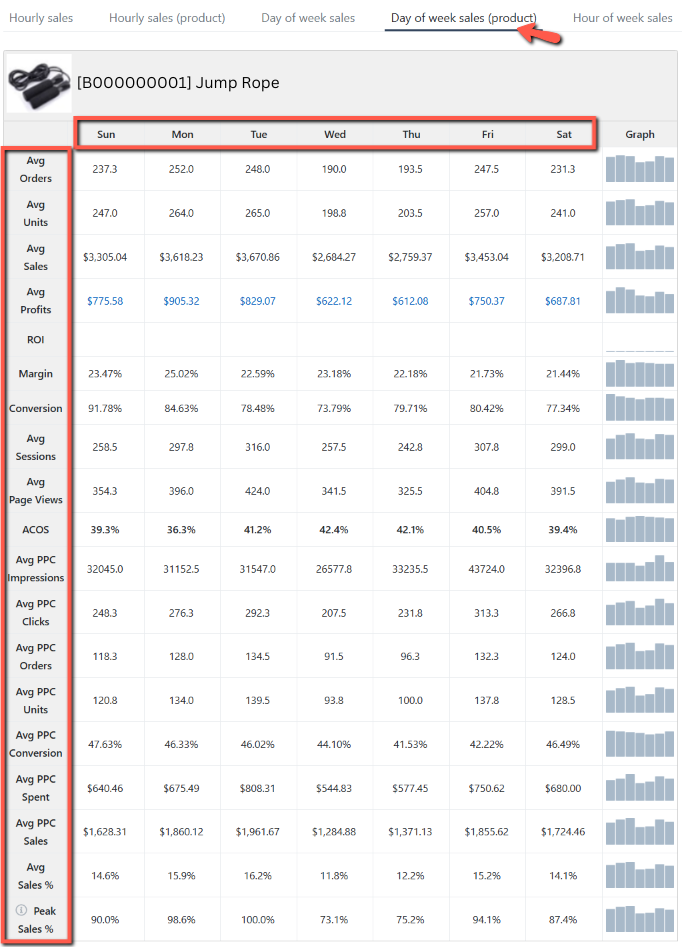
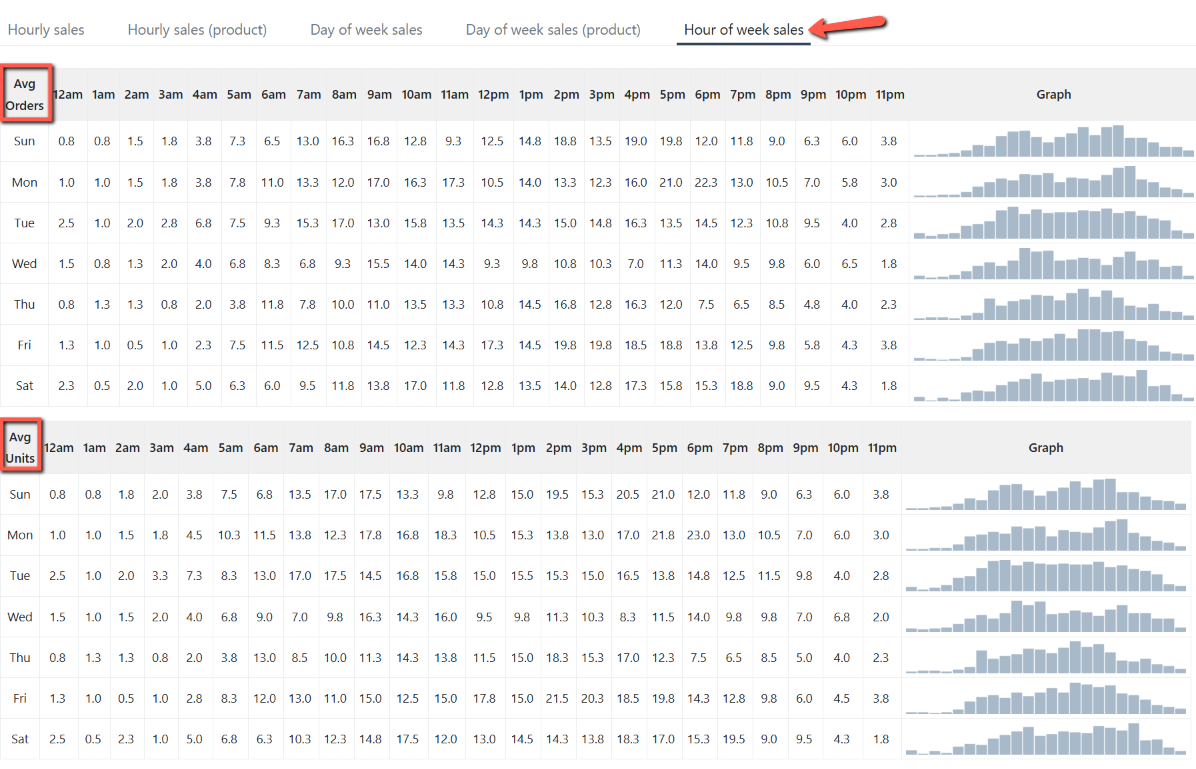
Hours of Week Sales
This tab shows the hourly average orders and units sold data for each day of the week.